
Cet article utilise le cas français pour affirmer que des ensembles de données alternatives peuvent être utilisés pour améliorer la capacité des décideurs politiques à surveiller les phénomènes socio-économiques en temps réel et à des endroits spécifiques. Dans la première partie de l’article, nous présentons une prévision immédiate de l’inflation basée sur des données internet, tant au niveau national que pour la ville de Provins, berceau du mouvement des Gilets jaunes. Nous présentons ensuite une analyse de l’élection présidentielle française basée sur l’analyse des réseaux sociaux. Tout d’abord, nous utilisons des techniques NLP (Natural Language Processing) pour extraire les sujets politiques les plus discutés sur les réseaux sociaux. Ensuite, nous utilisons un modèle de Deep Learning pour mesurer les sentiments sur Emmanuel Macron et Marine Le Pen à l’approche du scrutin afin d’estimer les intentions de vote en temps réel.
1. Introduction
In the past few years, the amount of available data skyrocketed worldwide. New and massive datasets from social media, satellites, and GPS signals, to name a few, are enabling researchers to generate new and valuable insights into socio-economic phenomena. The increasing availability of official data also played a vital role in enhancing our understanding of these dynamics. However, official data are released with a certain delay, while alternative data is often available in real-time. Therefore, we argue throughout this article that it is possible to build effective nowcasting tools based mostly on alternative data sources.
Our objective in this article is to show that alternative datasets can be used to create indicators that improve the ability of policymakers to monitor socio-economic phenomena in real-time and at specific locations. We make our argument by taking a deep dive into the French case. First, we present a nowcast of gasoline prices at the city of Provins, the birthplace of the Yellow Vests movement. In the sequence, we discuss how we used Natural Language Processing (NLP) techniques to create a barometer of public opinion in the foremath of the French 2022 presidential election.[1] First, we distilled social media information to track and analyse the most popular political topics. Secondly, we use a transformers-based deep-learning model to quantify the popularity of Emmanuel Macron and Marine Le Pen, the two frontrunners throughout the electoral period, to estimate vote intentions in real-time during the run-up to the ballot.
Our main conclusion is that policymakers can benefit from nowcasts based on alternative data sources in two important ways: i) they are available in real-time, enabling timely and data-oriented decision-making; and ii) they are available at the city level, allowing policymakers to target their policies to the specificities of each location.
2. Nowcasting economic indicators at the local level – Real-time local inflation indicator
2.1. Creating an inflation nowcast at the local level
QuantCube has developed an Inflation Nowcast Indicator which aims at tracking inflation in real-time at country and local levels. To create a nowcast of inflation, we follow the approach developed by statistical agencies to measure the Consumer Price Index (CPI), the standard inflation indicator[2]. In a nutshell, the methodology consists in measuring the evolution of prices of the different components of the consumption baskets of households and building the index as the weighted average of the different subcomponents. The weights of each subcomponent in the formula are updated annually by major statistical offices. Equation (1) summarizes the method:

where  represents the Consumer Price Index for each subcomponent
  and
and  the official weight attributed to it.
We developed a four-step methodology to create a nowcast based on alternative data sources. First, we perform a variance analysis on all subcomponents of the CPI[3] to find its most volatile components. Secondly, we collect relevant alternative data on prices to track these components. Thirdly, we clean the alternative data and combine it with lower frequency official data through a U-MIDAS model [6] to create a time series for each subcomponent. Finally, the weights used by official authorities to measure the CPI (INSEE in the French case) are used to generate the final indicators. We display our indicator as an inflation rate, i.e., its year-on-year variation.
To illustrate the methodology, Figure 1 shows the QuantCube France Inflation Nowcast. It is available in real-time, while official data is available with a two-week delay on average. Our nowcast achieves a correlation of 97% with official data, with a RMSE (Root Mean Square Error) of 0.25.
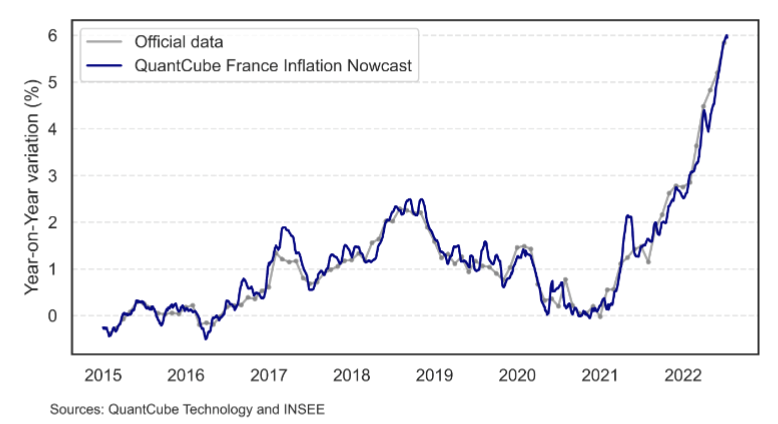
Figure 1 : QuantCube France Inflation Nowcast
A key advantage of our methodology is that it allows us to disaggregate it into nowcasts of each subcomponent. Moreover, given the granularity of the alternative data sources we use, we can also create the city-level indicators.
2.2. Local-level inflation: the example of the city of Provins
The Yellow Vests movement that erupted in France in 2018 underscored how higher petrol prices could lead to social unrest. For Mehleb, Kallis and al. (2021) [16], the Yellow Vest movement was a popular revolt caused by decreasing real incomes due to rising fuel prices, anger at uniform taxation that affects regions differently, and an ill-defined malaise against rising inequalities.
Figure 2 displays our indicator of fuel oil prices[4] for France and for the city of Provins – a city in the Seine-et-Marne department that was arguably the birthplace of the Yellow Vest movement. As one can see, the rate of gasoline inflation in Provins was often above the French rate before the eruption of the Yellow Vests movement in October 2018. The inadequacy of public transport networks in small cities such as Provins, at the edge of the Parisian metropolitan agglomeration, means that their inhabitants rely more on their vehicles than the inhabitants of Paris and other big urban centres. As a consequence, they spend, on average, twice as much on fuel as their Parisian counterparts[5]. Moreover, the median disposable income in Provins is 25% lower than in the Île-de-France region[6].
These factors help to understand why the Yellow Vests movement emerged in cities like Provins when the French government adopted a carbon tax to curb the consumption of fuel amidst a 10-percentage point increase in the rate of gasoline inflation. Indicators such as ours allow policymakers to understand the consequences of national policies on different cities and help them to act accordingly.
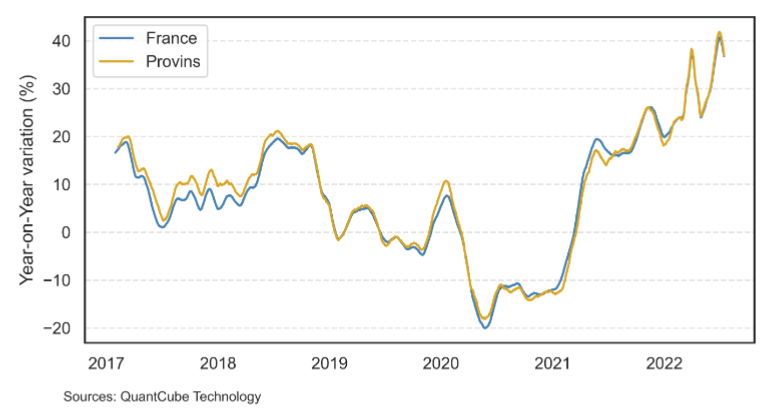
Figure 2: real-time estimation of oil inflation for the city of Provins between mid-2017 and April 2022
However, looking at Figure 2 makes one wonder whether the sharp rise in fuel prices that is taking place at the beginning of 2022 will lead to renewed social unrest in France. The record voting for Marine Le Pen – a far-right candidate who focused her campaign on rising living costs – in the 2022 French elections suggests that a diffused feeling of dissatisfaction lingers in the air. Yet, this dissatisfaction did not materialise (at the time of writing) into significant street protests. Our job openings indicator may offer some clues in this respect.
3. Tracking local political sentiment in real-time
Traditionally, politicians and political analysts monitored public opinion on key social subjects through surveys and polls. However, as Bertoni and al. [13] argues, a key problem of survey-based policy evaluations is their difficulty in detecting early signs of social discomfort, especially at the local level. Big data analytics can help fill this gap via advanced social media data mining using Natural Language Processing (NLP) techniques. In this section of the article, we present how we tracked the most popular political topics before the French 2022 elections at the French departments level, and how we created sentiment indices to estimate vote intentions for Emmanuel Macron and Marine Le Pen, the two frontrunners in the election, in the run-up to the ballot. This type of indicator can help policymakers formulate data-oriented and reactive policies adapted to each constituency.
3.1. Tracking public opinion with Topic Modelling
Big data analytics on social media data have proved invaluable for monitoring public opinion in real-time. Furthermore, they allow researchers to inexpensively obtain this type of information at a very granular level since many users share their city-level location [14]. Therefore, we relied on social media analytics to evaluate the evolution of French public opinion in the run-up to the elections in real-time.
More specifically, we gathered over 65 million local social media posts between January 17, 2022, to April 26, 2022. These posts were identified as politically oriented with the help of keyword filters. Furthermore, we did not consider posts sent via third-party apps to avoid bots and marketing messages. Finally, to geolocate our analyses, we matched user-set location fields with city locations using a fuzzy matching algorithm. analyzing the posts, we took two steps to cleanse the data: 1) normalization, where we remove accents, punctuation and special characters, and 2) lemmatization, where we remove plurals and inflectional endings to keep only the roots of each word. Finally, the posts were classified into one of six topics: international relations, social issues, economy, health, environment, and issues related to the local constituency[7] using a proprietary keyword-based filtering method.
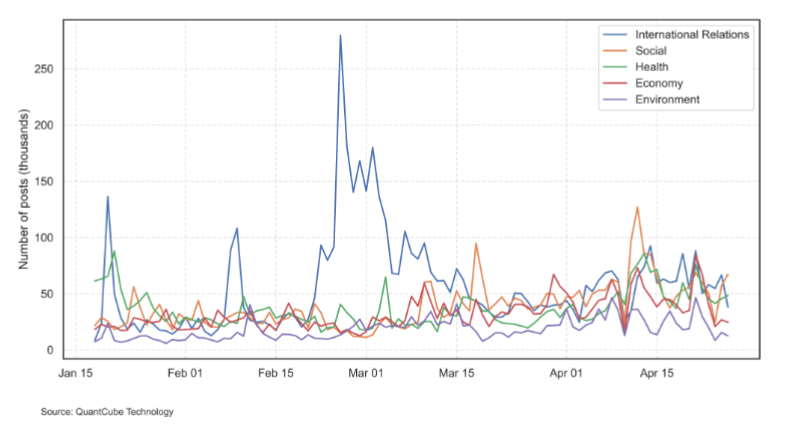
Figure 3: Evolution of topics in France
Figure 3 displays the evolution of daily posts by topic in France in the electoral period. It is also visible that economic concerns gained traction closer to the ballot day, reflecting the inflationary pressures and the focus of opposition candidates on rising costs of living, but also the progressive dismantling of Covid-19 related restrictions that took place in France in the first months of 2022.
To understand better what was being discussed at local levels, we took a closer look at the content of the posts in different French cities. Figures 4 and 5 display the most used keywords in economic discussions in the cities of Vernon and Lyon. Vernon, a small city within a one-hour drive from Paris, is representative of the cities that witnessed the emergence of the Yellow Vests movement in 2018, while Lyon, the third-largest French city, is representative of big urban conglomerates. At first glance, both wordclouds indicate that inflation was the main economic concern in the run-up to the elections, with tokens like prices (prix) and purchasing power (pouvoir [d’]achat) immediately visible. However, there is a subtle difference between the two wordclouds. In Vernon, fuel (essence) takes a huge space, with tokens not directly linked to inflation not as apparent. On the other hand, there is no such emphasis on fuel in Lyon, while other topics such as employment (emploi and chômage) and inequality (billionaires, milliard[aires]) were more prominent. These findings corroborate our previous discussion on inflation and show how policymakers can benefit from big data analytics to design policies adapted to each constituency.
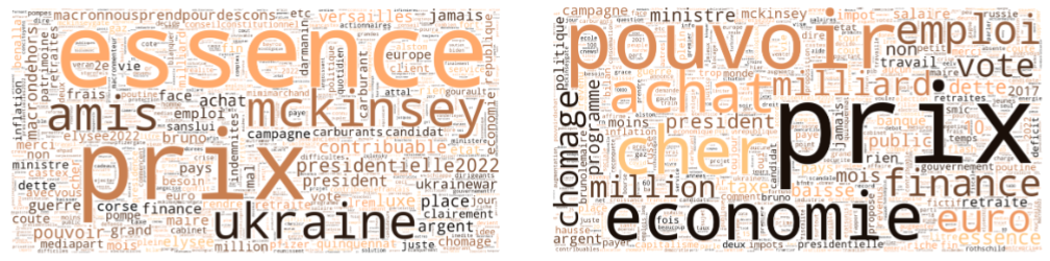
Figure 4: Wordcloud – Vernon / Figure 5: Wordcloud – Lyon
3.2. Data mining for local election sentiment with NLP deep learning model
Since the first articles on sentiment analysis were published in 2004 [9], sentiment indicators have been widely applied, with applications ranging from business and marketing [10], management of disasters [11], healthcare [12], and political issues. To further our understanding of the political environment leading to the French presidential election in 2022, we implemented a deep learning sentiment analysis model to measure the positive and negative sentiment towards the frontrunners in the French 2022 presidential election, using the results for nowcasting vote intentions in the run-up to the ballot.
Using a semi-automatic labelling method based on social media trends, we identified more than 15 million French posts clearly defined as pro or against the top-5 candidates in the polls in January 2022. We then trained a deep-learning transformers-based CamemBERT model [16] to classify political posts against the labelled set. Our model achieved an accuracy of up to 80% for predicting a post’s political affiliation on a labelled test set. Aggregating this information geographically, we could also create indicators of political sentiment at the local level.
For instance, in Figure 6, we show the evolution of Macron’s popularity in Paris. It clearly shows how Macron’s popularity increased following Russia’s invasion of Ukraine, suggesting a general approval of his diplomatic actions in the period. In Figure 7, we present the evolution of our national-level nowcast of vote intentions until the eve of the second round. The method was also useful to nowcast second-round vote intentions for Macron and Le Pen throughout the electoral period, as shown in Figure 7. As we can see in the graph, our nowcasts suggested that the voters were in favour of Macron throughout the electoral period, despite the momentum built by Le Pen’s candidature in the aftermath of the first round. A day before the second round, our nowcasts showed 54.5% vote intentions for Macron and 45.5% for Le Pen. These numbers were not far off from the final results of 58.5% for Macron and 41.5% for Le Pen.
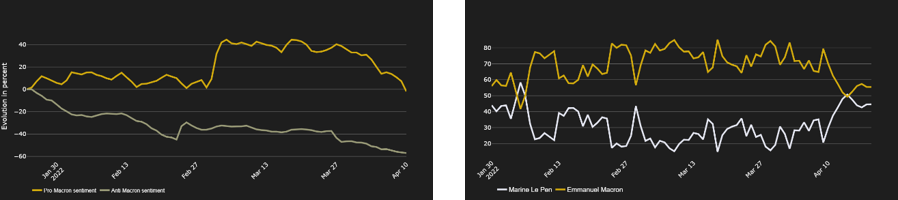
Figure 6 (left): Positive and negative daily Macron sentiment trends at the city level for Paris.
Figure 7 (right): National-level share of votes of Emmanuel Macron and Marine Le Pen from their mention in posts on social media before the first round of the 2022 presidential election
By leveraging alternative data sources, we were able to grasp public opinion throughout the electoral period at a local level and in real-time. Another important advantage of our methodology is that it is easily scalable, allowing us to analyse developments in different parts of the globe quickly. For example, we successfully applied this method to conduct a sentiment analysis for Russia when the war between Russia and Ukraine broke out in February 2022.
4. Final remarks
The applications presented in this article highlighted many potential applications of AI and Machine Learning techniques to process unconventional datasets in order to monitor socio-economic phenomena. We argued that policymakers could benefit from nowcasts based on alternative data sets in two crucial ways: i) they are available in real-time, enabling timely decision-making; and ii) they are available at different granularity levels, allowing the development of targeted policies.
However, socio-economic indicators based on alternative data should not only benefit policymakers. These metrics can significantly deepen the understanding of different constituencies, enabling a range of investment managers and corporates to sharpen their data-oriented investment decisions. This can be achieved either by helping them pick a location for corporate development, invest in residential or commercial real estate for higher long-term yields, or to invest in a specific sector for higher returns. Moreover, creating indicators at the city level that are updated in real-time provides more transparency at the local level, enabling authorities to leverage these numbers to secure funding for themselves through capital markets or private placement.
* Alice Froidevaux, Joao Macalos, Inès Khalfoun, Mathilde Deffrasnes, Stanislas d’Orsetti, Nicolas Salez, and Amélie Sciberras. 2022. Leveraging alternative data sources for socio-economic nowcasting. In Proceedings of the 2022 ACM Conference on Information Technology for Social Good (GoodIT ’22). Association for Computing Machinery, New York, NY, USA, 345–352. https://doi.org/10.1145/3524458.3547253
[1] The first round of the French presidential election took place on April 10, 2022, and qualified Marine Le Pen and Emmanuel Macron for the second round. The second round took place on April 24, 2022, when Emmanuel Macron was reelected president.
[2] The Consumer Price Index allows the estimation of the average variation of prices between two periods. It is computed on the observation of a fixed basket of goods updated on a regular basis (biannually for the United States, every five years for Germany). These indices are used to adjust pensions, wages, and contracts.
[3] Each subcomponent of the CPI is composed of several groups of items. For instance, the subcomponent Transport contains the groups Purchase of Vehicles, Operation of Personal Transport Equipment, Transport Services. See https://www.insee.fr/fr/information/2408172 for more information.
[4] Gasoline prices are a key item of the Operation of Personal Transport Equipment group of the Transport subcomponent of the CPI index.
[5] Structure des dépenses selon la catégorie de la commune de résidence – INSEE – Households expenditures in 2017 (https://www.insee.fr/fr/statistiques/4648335?sommaire=4648339#consulter-sommaire)
[6] In 2019, the average median disposable income in Provins was of 18,470 euros and 24,060 euros in the Île-de-France region (Comparateur de territoire − Région d’Île-de-France (11) | Insee, Comparateur de territoire − Commune de Provins (77379) | Insee)
[7] We focused on these topics because we identified them as top priorities for policymakers.
REFERENCES
- Choi, Hyunyoung and Varian, Hal R. 2012. Predicting the Present with Google Trends. Economic Record, vol. 88, pp. 2-9. DOI: http://dx.doi.org/10.1111/j.1475-4932.2012.00809.x
- D’Amuri, Francesco and Marcucci, Juri. 2017. The predictive power of Google searches in forecasting unemployment. International Journal of Forecasting, Vol.33, pp.801-816. DOI: 10.1016/j.ijforecast.2017.03.004
- Ferrara, Laurent and Simoni, Anna. 2019. When are Google data useful to nowcast GDP? An approach via pre-selection and shrinkage. Center for Economics and Statistics, Banque de France Working Paper Series No. 717.
- Giannone, Domenico and Lenza, Michele and Primiceri, Giorgio E., Economic Predictions with Big Data: The Illusion of Sparsity. FRB of New York Staff Report No. 847 (April 2018). DOI: http://dx.doi.org/10.2139/ssrn.3166281
- Angelini, Elena. Camba-Mendez, Gonzalo. Giannone, Domenico. Reichlin, Lucrezia and Ruenstler, Gerhard. Short-term forecasts of euro area GDP growth, Economic Journal, vol. 14, pp.C25-C44. DOI: https://doi.org/10.1111/j.1368-423X.2010.00328.x
- Cheng, Peng. Ferrara, Laurent. Froidevaux, Alice. Huynh, Thanh-Long. 2021. Massive Data Analytics for Macroeconomic Nowcasting. In: Consoli, S., Reforgiato Recupero, D., Saisana, M. (eds) Data Science for Economics and Finance. Springer, Cham. DOI: https://doi.org/10.1007/978-3-030-66891-4_7
- Navicke, Jekaterina, Olga Rastrigina, and Holly Sutherland. 2014. “Nowcasting Indicators of Poverty Risk in the European Union: A Microsimulation Approach.” Social Indicators Research 119, no. 1, pp.101–19. DOI: 10.1007/s11205-013-0491-8
- Pappalardo, Luca. Vanhoof, Maarten. Gabrielli, Lorenzo et al. 2016. An analytical framework to nowcast well-being using mobile phone data. Int J Data Sci Anal 2, pp. 75–92. DOI : https://doi.org/10.1007/s41060-016-0013-2
- Mäntylä, Mika V. Graziotin, Daniel and Kuutila. 2017. “The Evolution of Sentiment Analysis—A Review of Research Topics, Venues, and Top Cited Papers.” Computer Science Review, vol.27, pp.16-32. DOI: 10.1016/j.cosrev.2017.10.002
- Gursoy, Umman Tugba. Bulut, Diren and Yigit. Cemil. 2017. “Social Media Mining and Sentiment Analysis for Brand Management.” Global Journal of Emerging Trends in e-Business, Marketing and Consumer Psychology, vol. 3 (2017), pp.497-551.
- Ragini, J. Rexiline. P. M. Rubesh, Anand, and Vidhyacharan, Bhaskar. 2018. “Big Data Analytics for Disaster Response and Recovery Through Sentiment Analysis.” International Journal of Information Management, vol 42, pp.13-24.
- Ali, Kashif, Hai Dong, Athman Bouguettaya, Abdelkarim Erradi, and Rachid Hadjidj. 2017. “Sentiment Analysis as a Service: A Social Media Based Sentiment Analysis Framework”, in IEEE International Conference on Web Services (ICWS), Honolulu, Hawaii, USA. DOI: 10.1109/ICWS.2017.79
- Bertoni, Eleonora et al. 2022. Mapping the Demand Side of Computational Social Science for Policy. EUR 31017 EN, Publications Office of the European Union, Luxembourg. DOI: 10.2760/825111
- Zhiyuan Cheng, James Caverlee, and Kyumin Lee. 2010. You are where you tweet: a content-based approach to geolocating twitter users. In Proceedings of the 19th ACM international conference on Information and knowledge management (CIKM ’10). Association for Computing Machinery, New York, NY, USA, pp.759–768. DOI: https://doi.org/10.1145/1871437.1871535
- Louis Martin, Benjamin Muller, Pedro Javier Ortiz Suárez, Yoann Dupont, Laurent Romary, Éric de la Clergerie, Djamé Seddah, and Benoît Sagot. 2020. CamemBERT: a Tasty French Language Model. In Proceedings of the 58th Annual Meeting of the Association for Computational Linguistics, pp.7203–7219, Online. Association for Computational Linguistics. DOI: 10.18653/v1/2020.acl-main.645
- Mehleb, Rimel I. Kallis, Giorgos. Zografos, Christos. 2021. A discourse analysis of yellow-vest resistance against carbon taxes. In Environmental Innovation and Societal Transitions, 40, pp. 382-394. DOI: https://doi.org/10.1016/j.eist.2021.08.005
- Nick MacLaren and Rachana Shanbhogue. 2011. Using internet search data as economic indicators. Bank of England – Quarterly bulletin Q2, vol. 51, pp. 134-140. DOI: https://doi.org/10.2139/ssrn.1865276
- Popescu, Mioara. 2017. Modelling prediction of unemployment statistics using web technologies. HOLISTICA – Journal of Business and Public Administration, vol.8, no.3, pp.55-60. DOI: https://doi.org/10.1515/hjbpa-2017-0023
- Nicola Benatti, Vasco Botelho, Agostino Consolo, Antonio Dias da Silva and Malgorzata Osiewicz. High-frequency data developments in the euro area labour market. Economic Bulletin Boxes, European Central Bank, vol. 5.
- Yaping Caia, Kaiyu Guanb, David Lobelld, Andries B. Potgieterf, Shaowen Wanga, Jian Peng, Tianfang Xuh, Senthold Assengi, Yongguang Zhangj, Liangzhi Youl, Bin Pengb. 2019. Integrating satellite and climate data to predict wheat yield in Australia using machine learning approaches. Agricultural and Forest Meteorology, vol. 274, pp. 144-159. DOI: 10.1016/j.agrformet.2019.03.010
- David M. Johnson. 2014. An assessment of pre- and within-season remotely sensed variables for forecasting corn and soybean yields in the United States. Remote Sensing of Environment, vol. 141, pp.116-128. DOI: https://doi.org/10.1016/j.rse.2013.10.027
- Leveraging alternative data sources for socio-economic nowcasting* - 30 janvier 2023