
Pour un suivi clair de la Covid-19 — prévalence et sévérité à mesurer par sondage
L’article qui suit est une version légèrement condensée de celui publié dans le journal en ligne towardsdatascience.com, qui fait partie de medium.com[1] :
https://towardsdatascience.com/covid-19-anatomy-of-a-methodology-crisis-it-all-starts-with-data-collection-e23fcbcba54a[2]
Faute de mesure statistique robuste et continue des indicateurs de suivi épidémiques, il est nécessaire de faire des hypothèses sur les tendances de fond. L’ambiguïté, ou l’incertitude fondamentale sur les paramètres-clés des modèles, conduit à des débats parfois passionnés, souvent malheureusement davantage centrés sur les conclusions des modèles et les politiques à mener, que sur la méthode de collecte et d’analyse des données.
Aussi étrange que cela puisse paraître, pratiquement aucun pays — un contre-exemple notoire est le Royaume-Uni — n’a réalisé de mesure aléatoire de la prévalence pour la population dans son ensemble ; la sévérité, c’est-à-dire le risque d’une infection grave en cas de contamination, l’est encore moins.
Pourtant, l’ambiguïté, c’est-à-dire l’incertitude sur les paramètres du modèle, représente un aléa supplémentaire vis-à-vis duquel personne n’est neutre. L’ambiguïté conduit nécessairement soit à un pessimisme supplémentaire, soit à un optimiste supplémentaire — par rapport à la situation dans laquelle seul un risque, c’est-à-dire une distribution de probabilité connue, existe.
Dans le cas de la COVID, l’ambigüité peut être résolue de manière très simple, par une mesure statistique robuste. Il s’agit tout simplement de mener une enquête aléatoire régulière sur la prévalence et la sévérité des infections. Le coût d’une telle enquête serait inférieur à un million d’euros par an !
Cela permettrait de rendre le processus de décision plus robuste ; cela permettrait aussi part d’améliorer la communication des politiques publiques. Et mettrait fin à des oppositions stériles qui, plus que des différences d’opinion, reflètent parfois une attitude différente face à l’ambigüité.
Abstract: Without reliable measures of prevalence (viral circulation) and severity (the probability that infections lead to severe forms such as hospitalisation), the medium-term impact of viral circulation cannot be assessed robustly. A random survey of prevalence and associated severity would greatly robustify current research efforts, facilitate decision-making, and foster transparency in public policy, for cost less than €1 million per year.
Introduction

Figure 1: Garbage in, garbage out. https://xkcd.com/1838/
The naive view that sophisticated models can be applied regardless of the data quality explains why institutions with deep pockets neglect data collection.
Yet the best efforts of modelers are hampered by data quality and relevance to answer a given question. Lack of reliable data leads to less robust model output, and in turn in practice to more debatable conclusions than desired, even possibly to distrust in public action.
Deep pockets, at financial conglomerates, international institutions and governments, provide incentives to develop sophisticated models that potentially can use a variety of data sources, but robustness is not a characteristic of models on their own, but the ability to draw unambiguous conclusions to a question with the dataset and models at hands. Although parsimony is thought as a desirable model attribute to test simple models or hypotheses, a parsimonious model without robust data may not lead to robust predictions. Although data abundance and modern, complex models enable new insights or signals, sophistication has not prevented bankruptcies of financial conglomerates. In fact, unmanaged complexity is one of the causes of the 2008 financial crisis (see Greenspan, 2013 and the IMF’s 2008 Global Financial Stability Report).
In the case of the COVID epidemic, the poor measurement of two fundamental variables, prevalence and the severity of infections, leads to non-robust predictions regarding the medium-term impact of viral circulation or any policy related to viral circulation. It thus appears necessary to robustify the current research effort with sound and reliable data collection. Our proposal involves a random survey of prevalence.
Such a survey will permit tracking the viral transmission more precisely and for a cheaper cost than today. As a matter of fact, we reckon it can be implemented in each country or state with costs starting below one million euro per year. It will permit the monitoring of prevalence and severity in an unbiased way for the first time. The impact of viral circulation and governmental measures will be assessed in a transparent and non-debatable way. In turn, this will facilitate not only decision making but also communication and readability of public policies. This will foster transparency and confidence in vaccination campaigns and non-pharmaceutical interventions (such as quarantine).
This approach can be replicated at the relevant administrative or geographical level (region, state or country).
Note: prevalence is the fraction of people currently infected and can be thought as the population-wide positivity rate; incidence refers to newly infected persons.
I) A problem starts with a question and a model overview
I.1) Monitoring needs
The two essential components of the COVID epidemic can be summarised as the viral circulation (number of new infections) and its health impacts, both for individuals and for public health systems.
A fraction of new infections will lead to hospitalisations. This fraction, one possible measure of the severity of infections, may fluctuate (potentially in either way, see below). It thus must be monitored.
That the severity of infections varies in time is particularly true for the respiratory viruses, whose circulation can hardly be stopped.
I.2) With insights from the theory
For the population, the average severity of viral infections evolves in time, potentially increasing or decreasing with viral mutations, and always decreasing with the rise in immunity that results from previous viral circulation. It cannot be assumed constant and thus must be monitored.
Regarding immunity, it is essential to distinguish between immunity in the upper respiratory tract (“the nose”), and immunity of the lower respiratory tract (lungs as well as other internal organs).
- Immunity of the lower respiratory tract is efficient against severe forms, is long-lasting and can be called systemic immunity for concision (Mathew et al., 2020)
- Immunity of the upper respiratory tract, which would be needed to s. circulation, is weak and short-lived, notably because mucosal tissues in the nose are both exposed easily to aerial viruses and poorly irrigated. It can thus be said that there is no long-lasting mucosal, stopping or sterilising immunity (Russell et al., 2020).
The rise in systemic immunity does not fully prevent reinfections of the upper respiratory tract and further viral transmission but reduces the probability of severe infections. It thus implies a much greater fall in the severity of infections than in new cases.
The very same phenomenon happens with vaccines, which prevent severe cases, but only have a partial effect against viral circulation and reinfections. Our World in Data shows that new cases are currently much higher in the UK than in most less vaccinated countries; new cases have been similar in the heavily vaccinated Chilean population and its neighbouring poorly vaccinated Brazilean population. Hospitalisations, ICU and confirmed deaths have been much higher in countries where vaccination has been lagging relative to their better vaccinated neighbours (e.g. Brazil vs Chile).
The empirical severity may however potentially vary in either way, depending on the intrinsic strain virulence, hospital overload and for the aggregate, the age-structure of infections, exposure and vaccination (which must be controlled for). It tends to decrease with immunity, acquired either from exposure to the virus or from vaccination rollout.
II) The data collection: clear data trumps complex analyses
Governments perform regular surveys to monitor the popularity of their actions; thousands of surveys are performed monthly to monitor the economic activity, prices of consumer and industrial goods, and public opinion on a wide range of issues. But astonishingly, no such survey has been performed regularly for COVID infections, the severity of infections, and immunological defences in the population.
In fact, surveys, and the design of experiments (Fisher, 1935) are widely recognised as essential to collect information and test hypotheses. The United Nations’ Fundamental Principles of Official Statistics (1994) states that “data for statistical purposes may be drawn from all types of sources, be they statistical surveys or administrative records”
Yet PCR tests are not representative surveys.
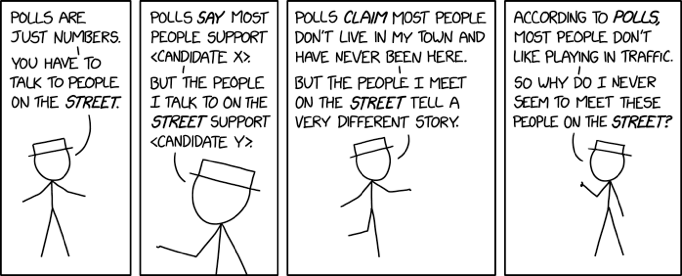
Figure 2 Those with symptoms tend to get tested more with PCR tests. Illustration from https://xkcd.com/2357/
In fact, estimating the circulation of the virus on the basis of self-reported tests is akin to estimating the probability of a Biden or a Trump victory by counting their Twitter followers rather than by usual population surveys. It’s neither standard nor robust statistical methodology.
III) Feeding the models correctly
III.1) The need to evaluate measurements
Infections as well as the severity of infections — which changes in time— being a crucial input to both short- and long-term forecasts, informative data is necessary to resolve the current model ambiguity.
Yet existing measures are severely biased:
- Current and new infections, are measured by essentially voluntary PCR tests, and Petersen and Phillips (2020) show that asymptomatic infected people under-test.
- Serological surveys, performed very irregularly, are neither timely nor can be taken as an unbiased proxy of immunity against Sars-CoV-2.[3] The extremely low rate of severe hospitalisations and deaths amongst persons of less than 30 years of age proves that systemic immunity can be acquired before exposure.
III.2) The impact of poor data collection in public forecasts
Forecasting hospitalisations and deaths require estimates of the viral exposure and of an implicit severity — the ratio of new deaths or new hospitalisations on new infections.
Monitoring the propagation of Sars-CoV-2, and the evolution of its severity would have been very simple with regular and reliable surveys of new COVID infections.
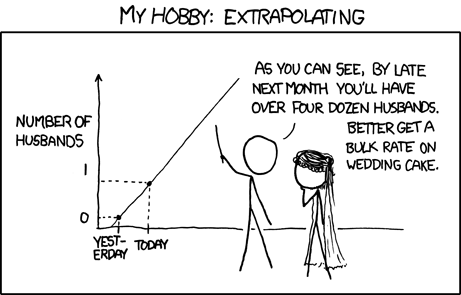
Figure 3 Hypotheses underlying extrapolation must be tested with care. https://xkcd.com/605/
Because these crucial parameters of epidemiologic models have not been explicitly measured, assumptions must be made about them.
Prevalence and severity are key to determining optimal public policies regarding viral circulation; the lack of robust measurement of these indicators leads to model ambiguity, and the use of assumptions regarding severity in models contributes to explain why government policies have varied greatly around the world.
IV) A call for better data collection
IV.1) Do for the COVID as you would do for others
Overall, random surveys and longitudinal studies are customary in daily economic life; matched (anonymously) with administrative data, they provide a wealth of information. The sample prevalence survey we recommend can be matched automatically with hospitalisation data, but also wages to assess the economic impact of COVID contamination. The need for an organised data collection is astonishingly obvious.
In the short run, it does not seem over-ambitious to require at least one precise measure of the circulation of the Sars-CoV-2 in the population.
Because Sars-CoV-2 is still perceived as an important risk, relevant monitoring of viral circulation must be implemented before periods of intense circulation. In the Northern hemisphere, respiratory infections tend to rise in October and fade in April — the current situation arguably (still) necessitates monitoring the rest of the year.
Monitoring viral circulation the whole year would cost a million euros (see appendix) and guarantee better monitoring of viral infections and ensure sound, rational and easy to communicate public policy responses. A cohort survey that would measure the probability of reinfection of vaccinated and non-vaccinated people would cost 2 million euros for whole year round. These costs can be tamed down when viral circulation is very low.
Appendices: Practical recommendation for rapid and efficient implementation.
a) The organisational difficulty
Large-scale surveys permit the gathering of detailed information across space (such as states, regions, cities) economic and sociological characteristics (age, economic activity) but also importantly to qualify interactions.
One of the practical difficulties in implementing such surveys lies in the perceived need to coordinate statistical and medical institutes.
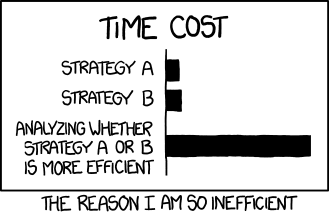
Figure 4 For simple procedures such as surveys, just do it or coordination? https://xkcd.com/1445/
Statistical institutes possess the population databases that permit the design of representative surveys, with different levels of stratification.
Health institutes possess the medical expertise to interpret tests yet are not customary with population-wide surveys.
Some of the serological surveys performed in spring 2020 involved the two institutes in a relatively inefficient way: the results were often published several months after the data were collected.
b) Representative surveys in the world
Although population-wide representative surveys are customary for all aspects of economic life, they have been seldom used for COVID around the world.
The best example of a population-wide representative survey is that conducted in the UK by the ONS, the COVID-19 Infection Survey data (ONS, 2020). This survey has amongst others permitted Petersen and Phillips (2020) to reckon the population percentage of asymptomatic positive PCR persons. Even in the UK, the mainstream estimate of prevalence (total number of cases) such as visible in the government dashboard are the number of positive tests conducted in all laboratories, rather than the ONS public representative survey.
In the US, some very specific publics have been surveyed in the CDC COVID 19 surveillance project, notably fragile populations (pregnant women, retirees), but non population-wide representative survey has been conducted for prevalence and incidence.
c) A review of costs
The cost of tests is negligible compared to the cost of the surveillance system already deployed.
Today, the only measure of viral circulation concerns the fraction of those who decide to test against COVID. A survey of the viral circulation /prevalence in the population could cost less than one million euros per year, which would be much more informative and much less costly than COVID-tracking apps whose development cost was in the order of 10 million euros.
Costs can be minimised using online survey, antigenic auto-tests (which can be bought for less than 6 euros),[4] and surveying viral circulation in large aggregate age-groups — the current measures from granular age groups are unfortunately poorly informative.
References:
CDC, 2020. COVID 19 surveillance project. https://www.abtassociates.com/projects/cdc-covid-19-surveillance-project
Greenspan, Alan. “Never Saw It Coming: Why the Financial Crisis Took Economists by Surprise.” Foreign Affairs, vol. 92, no. 6, 2013, pp. 88–96. JSTOR, www.jstor.org/stable/23527015
IMF, 2008. Global Financial Stability Report (GFSR), April. Structured Finance: Issues of Valuation and Disclosure.
Mathew et al., 2020. Deep immune profiling of COVID-19 patients reveals distinct immunotypes with therapeutic implications. Science (369)
ONS, 2020. Coronavirus (COVID-19) Infection Survey. https://www.ons.gov.uk/peoplepopulationandcommunity/healthandsocialcare/conditionsanddiseases/bulletins/coronaviruscovid19infectionsurveypilot/20august2021
Petersen I., Phillips E., Sept. 2020. Three Quarters of People with Sars-CoV-2 Infection are Asymptomatic: Analysis of English Household Survey Data. Clinical Epidemiology (12). https://www.dovepress.com/three-quarters-of-people-with-sars-cov-2-infection-are-asymptomatic-an-peer-reviewed-article-CLEP
Russell M., Moldoveanu Z., Ogra P., Mestecky J., 2020, Mucosal Immunity in COVID-19: A Neglected but Critical Aspect of SARS-CoV-2 Infection . Frontiers in Immunology (11). https://www.frontiersin.org/article/10.3389/fimmu.2020.611337
United Nations, 1994. Fundamental Principles of Official Statistics. http://unstats.un.org/unsd/statcom/commission.htm
Mots-clés : COVID – épidémies – sondages – risque modèle – time-varying parameters – politiques publiques – santé – statistiques – méthodologie projet
[1] On pourra également se référer à https://www.clubpraxis.com/publications
[2] Auteurs :
- Samuel j. Sender (CEO, squareyourdata; associate professor, Edhec) — idea and writing
- Mircea Sofonea (Associate Professor in epidemiology and evolution of infectious diseases, Uni Montpellier) — use of data in epidemiologic modelling in Montpellier and Europe
- Pierre Sonigo (chief scientific officer of Sebia laboratories) — immunological theory, sensitivity and interpretation of lab measurements such as PCR tests and serological surveys
[3] Antibodies are only one of the possible responses against SarS-COV-2 and furthermore they may fade with time. Technically, these surveys measure Sars-CoV-2 specific humoral response, that is, those antibodies which target the parts of the Sars-CoV-2 that cannot be found in other endemic coronaviruses. There are however other forms of immunological reactions against Sars-CoV-2, crossed immunity and cell-immunity also play an important role.
[4] Preliminary one-hour face-to-face interviews are typically needed at the start of a survey. These would cost about €200k for 1k persons, and €1M for 10k persons.
Mircea Sofonea (Associate Professor in epidemiology and evolution of infectious diseases, Uni Montpellier) — use of data in epidemiologic modelling in Montpellier and Europe
Pierre Sonigo (chief scientific officer of Sebia laboratories) — immunological theory, sensitivity and interpretation of lab measurements such as PCR tests and serological surveys
Commentaires récents